Know Your Dough
  • Home
    • News
  • About KYD
    • About KYD
    • Our Staff
    • Our Board
    • Our Impact
    • Contact Us
  • Programs
    • About Our Programs
    • Early Elementary: Piggy Power!
    • Upper Elementary: Money Moolah Bucks!
    • Middle School: The Money Game
    • High School: $$mart
    • Young Adults: $$mart
    • Customization
    • Guest Speakers
    • Testimonials
  • Donate
    • Annual Fundraiser
    • Donate
    • Become a Business Member
    • Paul Gervais Scholarship Fund
    • Thank You Donors!
  • Volunteer
    • Become a Volunteer
    • 2025-26 Volunteer Opportunities
    • Volunteer Training
  • Events
Picture

Impacting students, changing lives

Our impact on students is life-changing.  To measure impact, we administer the same pre-test and post-test to participants, including behavioral and financial skills questions.  We compare the results to determine the overall improvement. The tests directly measure knowledge, skill building and behavioral improvement before and after completing our programs.

In the last school year (2024-25)
we achieved 36% average increase in financial literacy 
across all programs!  
Picture

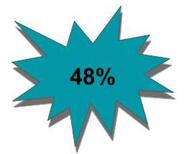
Incredible results for KYD's programs in 2024-25!  
​​
KYD measures results by % improvement from pre-program to post-program testing (identical test), 
​
including behavioral and skills questions.  
​
See our outstanding improvement results below:  
  • Overall Programs              *Overall improvement:  36%     **Behavioral:     25%         ***Skills:  45%
  • Middle Schools:                 *Overall improvement:  43%     **Behavioral:    30%         ***Skills:  52%
  • Elementary Schools:          *Overall improvement:  24%     **Behavioral:    27%         ***Skills:  23%

2024-25 Overall Improvement = 36%
2023-24 Overall Improvement = 37%
2022-23 ​Overall Improvement = 46%
​2021-22 Overall Improvement = 35%
2020-21 Overall Improvement = 32%
Picture
5- Year Program Results ​
Our results consistently amaze!  

In addition to schools,
​we work with various organizations in town focusing on at-risk populations. 

Our Impact Analysis and Infographic provide at-a-glance information about the benefits of Know Your Dough's outreach to the community. 
Impact Summary:  Previous School-Years

2024-25

Improvement in Financial Knowledge:  36%
Student lives impacted:  1199
Schools/Organizations:  23
Classrooms:  56
*Schedule constraints due to volume of requests for Spring classes

2023-24

Improvement in Financial Knowledge:  37%
Student lives impacted:  1448
Schools/Organizations:  26
Classrooms:  70
*$$MART programs introduced

2022-23

Improvement in Financial Knowledge:  46%
Student lives impacted:  882
Schools/Organizations:  14
Classrooms:  42
*Elementary programs re-deisgned and introduced

2021-22

Improvement in Financial Knowledge:  35%
Student lives impacted:  995
Schools/Organizations:  11
Classrooms:  35
*Post-Covid rebuilding year

2020-21

Improvement in Financial Knowledge:  32%
Student lives impacted:  639
Schools/Organizations:  10
Classrooms:  25
​*Covid & remote learning;  KYD developed online modules

2019-20

Improvement in Financial Knowledge:  28%
Student lives impacted:  853
Schools/Organizations:  7
Classrooms:  24
*Covid began in Spring
*DHS implemented mandatory Economics Class; KYD program no longer needed for 11th grade HSFF program

2018-19

Improvement in Financial Knowledge:  23%
Student lives impacted:  1027
Schools/Organizations:  10
Classrooms:  47

2017-18

Improvement in Financial Knowledge:  27%
Student lives impacted:  995
Schools/Organizations:  10
Classrooms:  42

2016-17

Improvement in Financial Knowledge:  30%
Student lives impacted:  1036
Schools/Organizations:  11
Classrooms:  40

 2015-16

Improvement in Financial Knowledge:  not recorded
Student lives impacted:  800
Schools/Organizations:  11
Classrooms:  30
Picture
Picture
Kathy Wilson 
Executive Director
 
[email protected]
www.know-your-dough.org
970-946-9824


Proudly powered by Weebly